Never having observed the effects of a complete solar cycle on signals before, or at least not having paid attention to them, hams continued to be impressed, intrigued, and puzzled by the changing on-air conditions as the minimum approached, still two years away as the new decade began. At least one thing was clear: Radio waves didn’t simply move from point to point along a straight line and decrease in strength with distance. Something else was happening too, but what?
In July 1920, QST noted that the usual summer radio season—meaning markedly worsening conditions—had entirely failed to appear.1 One reason had to do with an increased activity level and better equipment, but there was also an unusual lack of static on many nights. Equally strange was an increase in signal strength for some stations that had been heard only weakly the previous winter using the same equipment.
1TS observed that different segments of broad signals would fade differently. By constantly shifting his tune, he was able to continue copying a signal that was affected by fading. 8NZ thought he noticed that sharply tuned stations faded less than broad ones and attributed this to characteristics of the transmitter rather than propagation conditions. The editor concluded that both effects were due to shifting energy from one frequency to another, also blaming the transmitter. Yet he noted that NSF, with an “extremely sharp” signal, was not free from fading either. It was all quite confusing.
A.L. Groves of Brooke, Virginia observed that hams located in the same town using similar receivers, operator ability, and antenna direction, would hear entirely different groups of stations coming in loudly.2 One amateur might hear stations 500 miles away the strongest, another more like 100 to 150 miles, and for still another, the locals were strongest – and it seemed to depend on the height of the receiving antenna. He was on the right track, but did not yet understand that the groupings of received signals likely corresponded to different radiation angles.
Groves performed an experiment. With his antenna at 65 feet above ground he heard the Midwest best, including Chicago, Indiana and Ohio, but could hardly hear Washington, Baltimore, and Norfolk at all. Lowering his antenna to 30 feet, he could barely hear any 8th- and 9th-district stations but could now hear Baltimore stations “by the dozens.” He speculated that signal strength might be a function of the height of both receiving and transmitting stations’ antennas. The one exception was 8ER in St. Mary’s, Ohio, whom he could not seem to hear very well on any combination (which seems odd, given the fact that Mrs. Candler’s signal was one of the most prominent and easily copyable ones on the air).
He finally offered this insight, viewing QSS as an enhancement—albeit an unusable, unreliable one—rather than fading:
One cause of so much so-called freakishness is the fact that the amateur as a rule tries to work far in excess of the normal range of his set and calls it freakishness when he can’t get through one night or one hour as well as he can the next, when in reality it was only freakishness that allowed him to get through at all.
In relay work, therefore, Groves asserted that the emphasis should not be on maximum distance but on establishing reliable links.
Warner then wrote of an antenna scheme suggested in another letter from Groves, where horizontal wires at different heights were used, and mentioned a theory that “variation in conductivity of the atmosphere… ‘converts’ the radio waves to a higher or lower altitude.” They were getting close, but still did not quite appreciate things like radiation angle and sky waves.

Instead of going on indefinitely as was originally thought, the QSS tests would conclude on August 31 so that analysis could proceed and perhaps improve the experimental methods.3 The basic procedure remained unchanged. Transmitting stations repeatedly sent a complete alphabet, and receiving stations recorded the strength for each letter on a scale from 0 to 9. But intelligently choosing which stations to monitor and when was just becoming clear. By late summer, the test organizers were already recommending new monitoring procedures based on what had been learned thus far, in an effort to make the reports more meaningful. For example, more could be learned by repeatedly monitoring the same transmitting station at the same time each night than by switching around to listen to different ones.
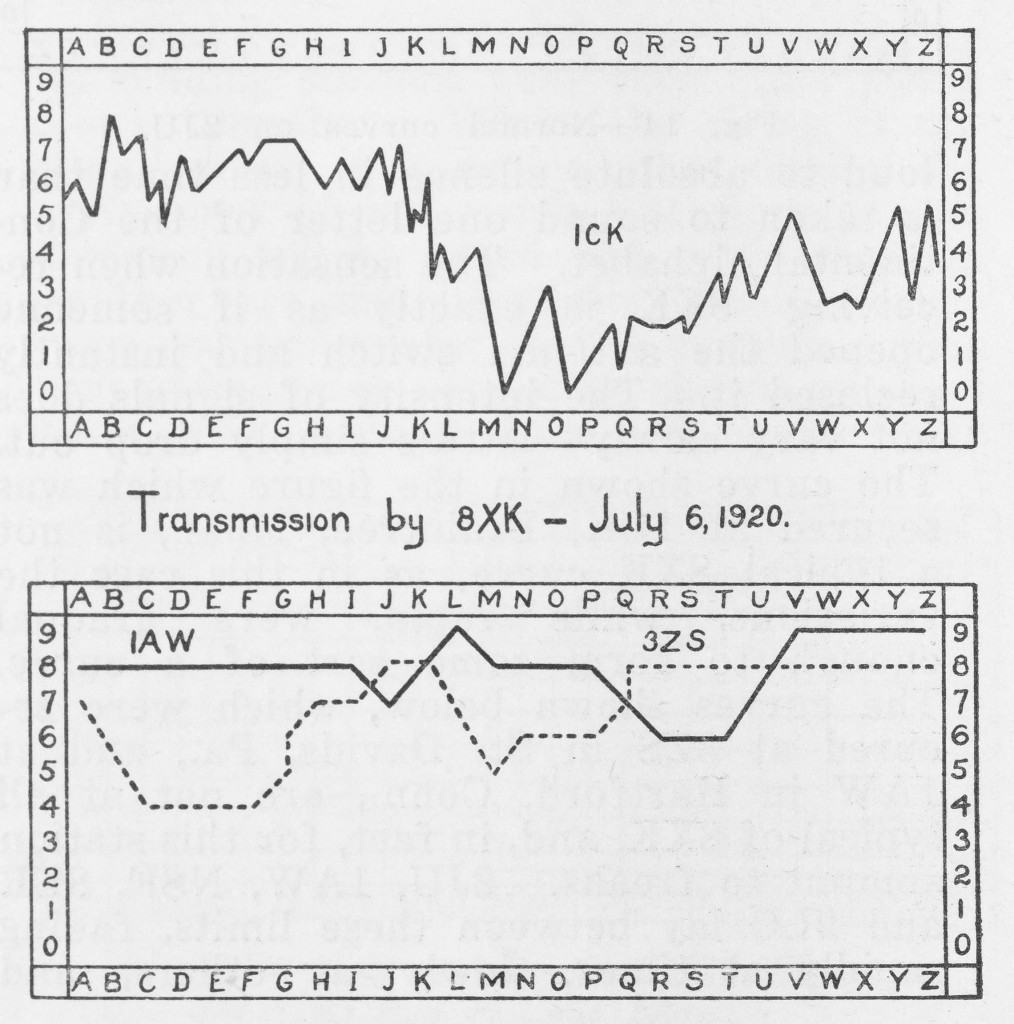
Example recorded curves for 8XK as received at 1CK, 1AW, and 3ZS
The Bureau tests would be tabulated and reported by the ARRL. Already the results seemed to support an increasingly popular scientific theory that reflection or refraction of waves was the cause of fading. The evidence for this was “progressive fading”—that which varied successively along a line outward from the transmitter—which could only be explained by a reflection mechanism occurring high in the atmosphere. The example test station cited for this was 2JU whose transmissions showed, in one case, a fading characteristic that began later in time at each of several receiving stations progressively spaced further away. Continued analysis might make it possible to calculate the position of “the reflecting media,” whatever it was, learn about it, and maybe do something about it (still hoping!). They also believed that changes in received wavelength, as reported by some, were merely reception artifacts. It was possible, however, for a broad transmission to simultaneously fade on one wavelength and not on another.
The first part of the long-awaited report led the November issue of QST .4 The entire report had already been presented to the R.C.A. on 24 September at Columbia University. Written by frequent QST technical author Robert S. Kruse, who also held the title of Assistant Electrical Engineer at the Bureau of Standards, the article described how the tests were run. They had been a collaborative government-amateur operation, exemplified by Kruse, a member of both groups. The ARRL selected the stations and conducted the operation, and the Bureau analyzed the reports and provided overall guidance.
Hams were particularly interested in the prevalence of fading effects in shortwave work – so much so that QSS had now become as often used on the air as QRM and QRN in describing adverse conditions affecting relay work. Many thought that if by running tests amateurs could better understand the phenomena, they might be able to avoid it. Few yet considered using and exploiting a newly discovered capability.
Six amateur stations and NSF, the Navy station in Washington, were selected to transmit at specific times each Tuesday, Thursday and Saturday night for six weeks during the summer. The group included some of the most well-known amateurs in relay work: 1AW, 8XK, 9ZN, 8ER, and 9LC. All had received special authority to use a 250-meter wavelength. Kruse himself manned WWV, the Bureau of Standards station in Washington, D.C.
Fifty-one receiving, or recording, stations were chosen, from the Atlantic coast west to Illinois and Iowa, and from New Hampshire south to Virginia and Tennessee. Among the recorders were many more accomplished relayers including Vermilya, 1ZE. They all used similar antennas and a Paragon receiver consisting of a regenerative detector and a two-stage audio amplifier. While each transmitting station took its turn sending the test sequence, the remaining six acted as recorders.
Although criticized for their decision, the test organizers confined the operation to the northeast in order to make the analysis task manageable—the more than one thousand expected reports would make it tedious and time consuming—and because a greater number of qualified stations were available there.
Tests were conducted at a wavelength of 250 meters under a special government permit (which was not required for 9ZN and 8XK, both of whom already had special licenses, and NSF, a government station). Warner and Maxim at 1AW in Hartford ran their own preparatory experiment to test the repeatability of the recording method. Listening to 2JU transmitting from Long Island they demonstrated that two independent listeners would always produce curves of the same general sequence of ups and downs, although absolute levels and precise shape might vary. Before receivers had S-meters and no other quantitative measurement of received signal strength was in use, the QSS tests relied on ears to detect, and brains to judge, signal levels.
Each test commenced at 10:00 p.m. eastern time with all transmitting stations listening for the time from Arlington. 1AW would then announce the test by sending a QST beginning at 10:10, and each of the other transmitting stations would follow at 10-minute intervals.
In December, Part 2 of the report presented the initial results, from those tests which took place under summer conditions—that is, during the final month.5 Several notable things had been demonstrated:
There were three kinds of fading: very rapid, moderately fast, and slow. And it was conclusively a “distance phenomena,” since no receivers observed fading of signals from nearby transmitters.
One could often correlate results (“checks”) from several receiving stations within the same geographical area that were all monitoring the same transmitting station. Sometimes such a correlation of reports could also be observed between receiving stations that were further apart. Occasionally a correlation would be displaced in time, with a curve repeating itself later in the alphabet at one station compared with a second. Sixteen of these time-sequenced correlations were discovered that involved three stations, and thirty-two that involved only two (and were discounted). No weather correlation was found at all.
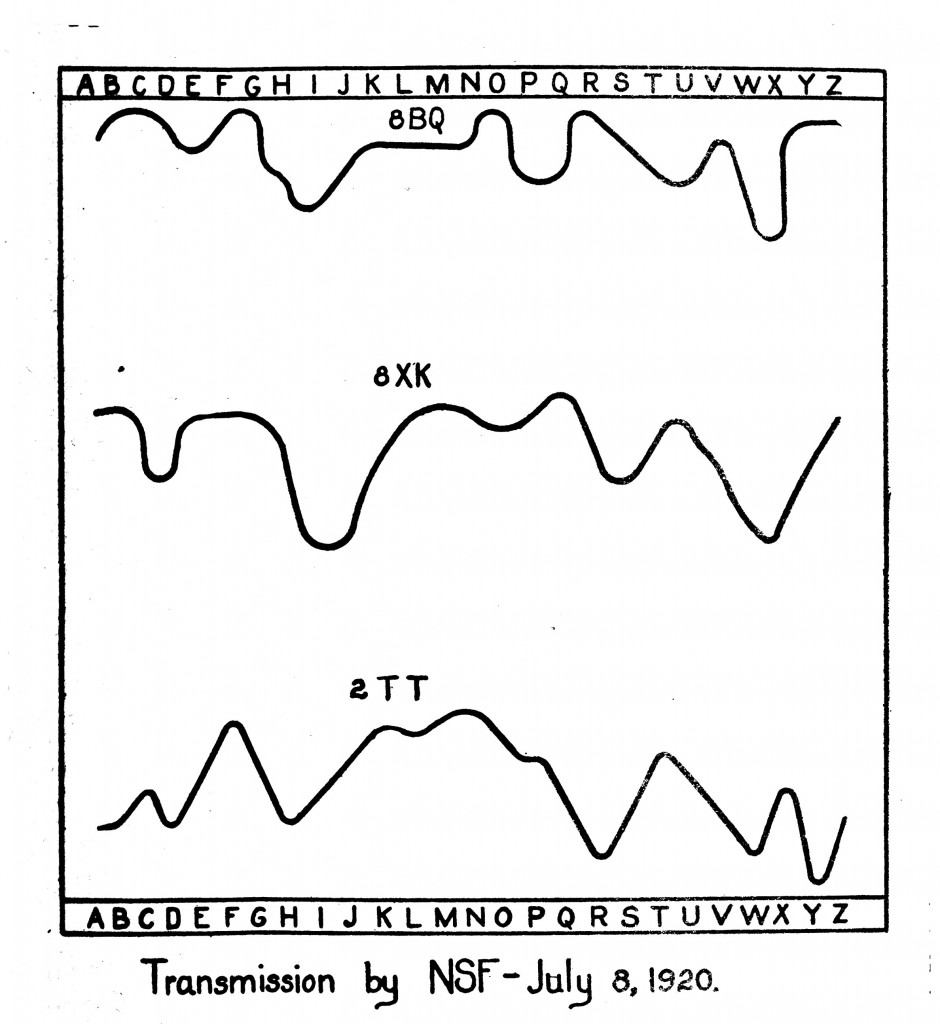
An example of “checks”
Another correlation—inverse curves—was a pair of curves in which one had a shape roughly the mirror image the other. It was not frequently observed, though, and Kruse speculated that they might only be coincidences.
Analysts began to speculate about the physical phenomena that might account for their observations. For example, if the theory about reflection or refraction layers was correct, such a layer would have to be very large and could be “a large cloud, fog bank, mass of fumes from an industrial plant, or perhaps the Heavyside layer,” an atmospheric layer predicted by scientists but not yet confirmed by experiment.
3ZF later postulated that ground waves were absorbed while waves at higher angles were reflected by a “stratum in the atmosphere”—and perhaps there was destructive interference taking place between ground and sky.6
Almost unanimously the test recorders believed that fading was not due to signal strength variation at all, but wavelength variation (though not caused by the transmitter itself) since they could usually recover a signal by retuning—misunderstanding that a broad spark signal might undergo selective fading. Participants were therefore asked specifically not to retune and thereby introduce another variable. Furthermore, Kruse discounted this notion by reporting that modulated CW signals7 could not be recovered this way and exhibited no trace of the effect.
Even more hams participated in the second series of QSS tests held in October than the first. Over 2,200 records had been reported by the new year even with spotty participation in some of the districts.8 In particular, no good data had been received from Cleveland and Philadelphia, primarily due to the QRM problem from unlicensed spark coil stations. It seemed they might actually have outnumberd properly licensed stations in those cities. Warner suggested that the two prominent local clubs should work to clean up the situation but advised caution, writing,
We suggest the appointment by each club of a strong Investigation committee, charged with the duty of digging out these offenders. Wouff-Hong tactics should not be used at first, as without doubt many of these men do not know that they are violating a Federal law, and a spirit of friendly cooperation and assistance in enlightening them and helping them to secure licenses will result in more good stations, more members for the clubs. And the conversion of a dangerous situation into a local organization of which any club may be proud.
The final report on the QSS tests named the winners of the Bureau of Standards’ prizes for receiving. Maxim was declared the overall winner after applying a somewhat complex scoring scheme.
Solar phenomena, signal fading (or enhancement),and the changes with distance and antenna height—it all added up to something. Probing the limits of understanding how radio waves behaved, hams had just scratched the surface, not quite yet understanding something that would be a bigger prize for them all.

de W2PA
- “Lost – a 1920 Summer Season,” Editorial, QST, July 1920, 23. ↩
- “On Freak Reception,” Radio Communications by the Amateurs, QST, July 1920, 50. ↩
- “The A.R.R.L. QSS Tests,” QST, August 1920, 5. ↩
- S. Kruse, “The Bureau of Standards—A.R.R.L. Tests of Short Wave Radio Signal Fading, Part 1,” QST, November 1920, 5. ↩
- S. Kruse, “The Bureau of Standards—A.R.R.L. Tests of Short Wave Radio Signal Fading, Part 2,” QST, December 1920, 13. ↩
- J. V. Purssell, “Theory of Freak Transmission,” QST, November 1921, 24. ↩
- Interrupted Continuous Wave (ICW) is a CW signal modulated using a “chopper” to pulse it, thereby making it audible without using a beat oscillator. ↩
- “The Fading Tests,” QST, January 1921, 12. ↩